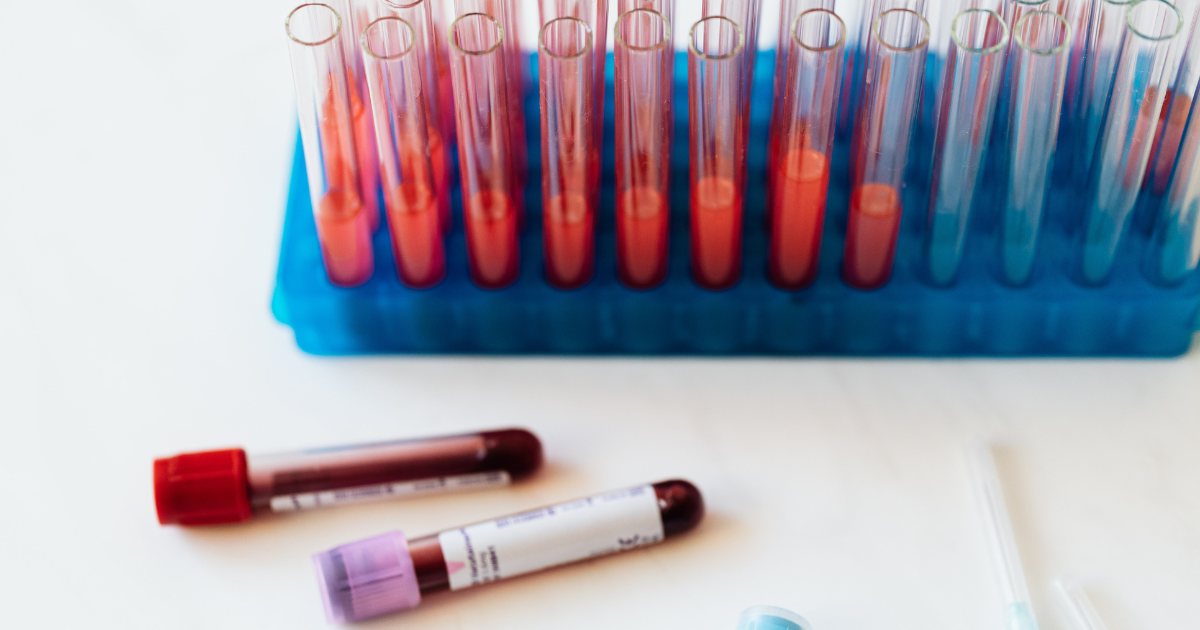
Hemolysis in Laboratory Samples: Causes, Consequences and How to Prevent It
Hemolysis is the leading cause of specimen rejection in clinical laboratories — responsible for up to 96% of rejected samples in some settings, and one of the most persistent sources of pre-analytical error in laboratory medicine. Yet most laboratories encounter it only at the point of consequence: a pink serum, a flagged result, a sample that must be redrawn. The root cause — what happened to that sample before it reached the analyzer — remains largely invisible. This guide explains what hemolysis is, which tests it compromises and how severely, and how laboratories can systematically reduce it rather than simply react to it.
What Is Hemolysis?
Hemolysis is the rupture or destruction of red blood cells (erythrocytes), resulting in the release of their intracellular contents — primarily hemoglobin — into the surrounding serum or plasma. In a clinical laboratory context, the visible consequence is a specimen with a characteristic pink to red coloration, ranging from pale rose in mild cases to deep red in severe ones.
It is useful to distinguish hemolysis from the other two main specimen interferences that affect laboratory results: icterus (yellow-orange discoloration caused by elevated bilirubin) and lipemia (milky turbidity from elevated triglycerides). All three can cause photometric interference in certain assays, but their mechanisms, affected analytes, and origins differ substantially.
Hemolysis also exists on a spectrum. Severe hemolysis is immediately apparent on visual inspection; mild to moderate hemolysis may be entirely invisible to the naked eye and detectable only through automated measurement — the hemolysis index (H-index). This matters because even mild hemolysis can produce clinically significant errors in sensitive analytes well before it becomes visible.
In Vitro vs In Vivo Hemolysis
The most important distinction in laboratory hemolysis management is whether red blood cell lysis occurred within the patient’s body or was introduced during the pre-analytical process.
In vivo hemolysis reflects an underlying pathological condition — haemolytic anaemia, transfusion reactions, sepsis, or certain drug toxicities. It is genuinely present in the patient’s circulation. The laboratory cannot prevent it, and results from an in vivo hemolysed sample, while affected by interference, carry clinical information about the patient’s actual haematological state. The appropriate response is to flag the interference and interpret results in their clinical context.
In vitro hemolysis, by contrast, occurs after blood has been collected. The red blood cells were intact when they left the patient; they lysed during phlebotomy, tube handling, transport, or processing. Any analyte interference it produces is entirely artefactual — the result does not reflect the patient’s true values. This is the category that laboratory quality programmes can and should address.
The challenge is that a received hemolysed specimen does not come labelled with its origin. The H-index does not distinguish in vitro from in vivo lysis. Systematic pre-analytical monitoring is what allows laboratories to identify patterns of in vitro hemolysis — and intervene on their root causes.
| In Vitro Hemolysis | In Vivo Hemolysis | |
|---|---|---|
| Origin | Collection, transport or handling | Patient’s own pathological process |
| Cause | Phlebotomy technique, mechanical agitation, temperature, delayed centrifugation | Haemolytic anaemia, transfusion reaction, sepsis, drug toxicity |
| What results mean | Artefactual — does not reflect patient’s true values | Genuine finding — reflects patient’s haematological state |
| Lab response | Reject, investigate root cause, recollect | Flag interference; interpret in clinical context |
What Causes Hemolysis in Laboratory Samples?
In vitro hemolysis does not arise from a single event. It accumulates across three stages of the pre-analytical phase, each contributing its own set of risk factors.
During collection- 1Needle gauge too smallNeedles narrower than 21G generate shear forces that physically rupture red blood cells as they pass through the lumen. This is one of the most frequent causes of collection-related hemolysis.
- 2Prolonged tourniquet applicationTourniquet time beyond one minute causes venous stasis, which concentrates cellular components and increases RBC fragility. Release the tourniquet before drawing blood where possible.
- 3Difficult venipunctureMultiple attempts, slow blood flow, collapsed veins, or drawing from peripheral IV lines or haematoma sites increase mechanical trauma to red blood cells during collection.
- 4Underfilled tubesInsufficient blood volume alters the blood-to-additive ratio and increases vacuum-induced shear stress on RBCs. Fill each tube to the manufacturer’s indicated level.
- 5Vigorous mixing after collectionTubes must be mixed by gentle inversion only — five to ten times, slowly. Shaking or vortexing causes immediate mechanical hemolysis regardless of collection quality.
- 6Delayed centrifugationProlonged contact between serum and red blood cells causes passive leakage of intracellular components. Centrifuge within 30 to 60 minutes of collection; always within 2 hours.
- 7Incorrect centrifugation parametersSpeed too high, duration too long, or use of an incorrect rotor type can cause lysis. Always follow manufacturer specifications for each tube type.
- 8Temperature extremesFreezing primary gel tubes causes ice crystal formation and cell lysis. Exposure to heat above 37°C accelerates metabolic depletion and RBC membrane breakdown.
- 9Mechanical shockDropping carriers, rough loading and unloading, or tubes moving freely inside transport containers generate impact forces that rupture cells during transit.
- 10Temperature excursionsSamples without adequate thermal protection are vulnerable to heat damage in summer conditions and freezing exposure in winter — both of which cause hemolysis.
- 11Extended transit timesParticularly problematic for samples that have not yet been centrifuged. Long transport increases passive hemolysis from cell-serum contact and cumulative temperature exposure.
Over 60% of the conditions that cause in vitro hemolysis originate during collection and transport — before the sample reaches the laboratory. This is where systematic prevention must begin.
- Needle gauge < 21G
- Tourniquet > 1 minute
- Difficult venipuncture
- Underfilled tubes
- Vigorous mixing / shaking
- Delayed centrifugation (> 2h)
- Incorrect centrifugation speed
- Temperature extremes
- Freezing primary gel tubes
- Mechanical shock in transit
- Temperature excursions
- Extended transit time
- Tubes moving freely in carrier
Which Laboratory Tests Are Most Affected by Hemolysis?
Hemolysis interferes with laboratory results through two distinct mechanisms. First, it releases intracellular components directly into the specimen: analytes present at far higher concentrations inside the red blood cell than in plasma will appear falsely elevated. Second, free hemoglobin — the primary product of RBC lysis — absorbs light at wavelengths used by photometric analyzers (typically around 415 nm), introducing spectrophotometric interference in colour-based assays regardless of whether the analyte itself is affected by RBC content.
| Analyte | Effect of Hemolysis | Mechanism |
|---|---|---|
| Potassium (K+) | Falsely elevated | Intracellular K+ is 20–150× higher than plasma; most clinically dangerous interference |
| LDH | Falsely elevated | Most sensitive hemolysis indicator; intracellular concentration extremely high |
| AST | Falsely elevated | Intracellular AST approximately 40× plasma level |
| ALT | Mildly elevated | Intracellular concentration higher than plasma, but concentration differential less extreme than AST |
| Magnesium | Falsely elevated | Significant intracellular reservoir released on lysis |
| Phosphate | Falsely elevated | Released from RBC membrane and intracellular stores |
| Total bilirubin | Falsely elevated | Spectrophotometric interference — hemoglobin absorbs at the assay measurement wavelength |
| Insulin | Falsely decreased | Proteases released from lysed RBCs degrade insulin in the specimen |
| Coagulation assays | Results unreliable | RBC lysate activates the coagulation cascade; clotting times affected |
The degree of interference depends on the H-index, the specific analyte, and the analyzer platform. Laboratories must use manufacturer-specific interference tables — thresholds are not universal across instruments.
Even 1% RBC hemolysis adds approximately 1.5 mmol/L to serum potassium — enough to push a normal result into the range that triggers clinical intervention. A patient may receive calcium gluconate, insulin-glucose infusion, or cation-exchange therapy for a potassium elevation that exists only in the tube, not in their bloodstream. This is one of the most consequential errors hemolysis produces in acute care settings.
How Is Hemolysis Detected?
Laboratories have two tools for detecting hemolysis in a received specimen.
Visual assessment is the simplest approach: a hemolysed sample has a visible pink to red colour in the serum or plasma. However, free hemoglobin below approximately 0.3 g/dL — equivalent to roughly 20–30 units on most H-index scales — is typically invisible to the naked eye. Mild hemolysis, which can nonetheless cause clinically significant interference in sensitive analytes such as LDH and potassium, is routinely missed by visual inspection alone.
The hemolysis index (H-index) is measured automatically by modern chemistry analyzers using spectrophotometry or bichromatic analysis at specific wavelengths. It provides a standardized, quantitative estimate of free hemoglobin concentration and is reported either as a numerical value or on a graded scale (1+, 2+, 3+). Most laboratory information systems can be configured to flag results and hold reporting automatically when the H-index exceeds defined thresholds for specific analytes.
H-index thresholds are analyte- and instrument-specific. A hemolysis index that is acceptable for a TSH or CRP result may be entirely unacceptable for potassium or LDH on the same analyzer. Laboratories must define and apply their thresholds using the manufacturer’s published interference data for their specific platform — generic thresholds are not valid.
The True Cost of Hemolysis
Hemolysis exerts costs at every level of laboratory operations.
At the specimen level, a rejected hemolysed sample requires recollection: a second phlebotomy event, a second transport cycle, a second processing run. This adds 30 to 90 minutes to the turnaround time of the affected result in the best case — considerably more for samples collected at remote sites, outpatient clinics, or from patients with difficult venous access.
At the patient level, repeat blood draws increase discomfort and procedural risk, particularly in neonates, elderly patients, or those receiving anticoagulation therapy. In time-sensitive settings — emergency medicine, intensive care, perioperative monitoring — the consequences of a delayed result extend beyond inconvenience into patient safety.
At the operational level, the scale is significant. Hemolysis is the leading cause of specimen rejection in clinical laboratories, responsible for 18–96% of rejected specimens across published studies and approximately 1.99% of all submitted blood samples — based on a pooled analysis by Lippi G et al. across 26 studies and over 16 million specimens. In emergency departments, where speed matters most, hemolysis rates reach 25–30% of all blood specimens, with rejection rates exceeding 4%.
Estimates based on pooled literature data (Plebani M, 2012; Lippi G et al., 2013). Distribution varies by laboratory setting.
These are not isolated quality events. At any meaningful sample volume, hemolysis rejection represents a quantifiable burden on staff capacity, instrument throughput, and laboratory turnaround time — all driven largely by conditions that occur before the sample reaches the laboratory.
How to Prevent Hemolysis
The great majority of in vitro hemolysis is preventable. The following checklist addresses each stage of the pre-analytical process where intervention is both possible and evidence-based.
Phlebotomy- 1Use a 21G or larger needle for standard adult venipunctureFor difficult access, resist the temptation to use a smaller gauge — the hemolysis risk from increased shear forces outweighs the perceived access benefit in most cases.
- 2Release the tourniquet within one minuteIdeally release immediately before drawing blood. Prolonged venous stasis is one of the most controllable and most underestimated hemolysis risk factors in routine phlebotomy.
- 3Avoid drawing from compromised sitesHaematoma sites, peripheral IV lines, and intravenous infusion ports all elevate hemolysis risk significantly. Choose an alternative site wherever the clinical situation allows.
- 4Fill tubes to the indicated volumeUnderfilling alters the blood-to-additive ratio and increases vacuum-induced shear on red blood cells. Observe the fill line marked on each tube type.
- 5Mix only by gentle inversionFive to ten slow inversions, no shaking, no vortexing. This single-step habit has a disproportionate impact on collection-related hemolysis rates across an entire phlebotomy team.
- 6Centrifuge within 30–60 minutes of collectionProlonged cell-serum contact causes passive hemolysis. Where immediate centrifugation is not possible, 2 hours is the outer limit for most routine chemistry tubes.
- 7Apply correct centrifugation parametersSpeed, duration, and rotor type must match the tube manufacturer’s specifications. Excessive centrifugal force is a direct and often overlooked cause of processing-related hemolysis.
- 8Store samples at 15–25°C between collection and centrifugationDo not refrigerate primary gel tubes before centrifugation (risks cold agglutination and lysis), and never expose samples to temperatures above 37°C during interim storage.
- 9Secure tubes upright in padded carriersTubes must not move freely within the transport container. Mechanical shock during loading, delivery, or road transit is a primary cause of transport-related hemolysis.
- 10Maintain temperature throughout transitUse insulated carriers appropriate to the ambient season. Temperature excursions — heat in summer, cold in winter — both cause hemolysis in unprotected samples, often without visible signs on the tube exterior.
- 11Minimise transit time for uncentrifuged samplesExtended transit time increases both passive hemolysis from cell-serum contact and cumulative temperature exposure. Communicate collection times to the laboratory for STAT samples whenever possible.
- 12Monitor STAT transport in real time where possibleA sample sitting uncollected after phlebotomy, or stuck in transit during a temperature excursion, cannot be corrected once it arrives at the laboratory. Real-time monitoring converts a discovered problem into an actionable alert.
Following these steps addresses the most common root causes of in vitro hemolysis. What protocol alone cannot address is the detection of deviations as they happen — before the sample arrives damaged.
The Pre-Analytical Blind Spot
A hemolysed sample arrives at the laboratory already damaged. The H-index tells the laboratory what happened; it does not tell it when, where, or why. Was the tourniquet left on too long? Did the sample sit uncollected for 90 minutes after phlebotomy? Was it exposed to heat during summer road transport? Without data from the pre-analytical phase, these questions cannot be answered reliably — and they cannot be corrected systematically.
This creates a structural limit on quality improvement programmes. Training phlebotomists and couriers addresses technique; standard operating procedures set expectations; periodic audits identify systemic patterns. But if the pre-analytical phase is not instrumented — if there are no timestamps, no temperature records, no real-time alerts — deviations from protocol are discovered only after the fact, through a rejected specimen, not through a signal that could have prompted intervention while the sample was still in transit.
Laboratories that achieve consistently low hemolysis rejection rates are not only those with excellent phlebotomy training. They are the ones with end-to-end visibility: sample tracking systems that record when a sample was collected, how it was handled during transit, and whether it arrived within acceptable parameters. This visibility is what converts a reactive quality metric (rejection rate) into a preventive process (real-time intervention).
For a detailed look at what systematic pre-analytical monitoring involves, the article on sample identification in the pre-analytical phase explains the evidence and the infrastructure that makes it possible.
Key Takeaways
- Hemolysis is the rupture of red blood cells releasing intracellular contents into serum or plasma; visual inspection alone is insufficient for mild cases — the hemolysis index provides the only reliable quantitative measure.
- In vitro hemolysis (preventable, originating in collection, handling and transport) must be distinguished from in vivo hemolysis (pathological, originating in the patient) — the laboratory’s response and the clinical interpretation differ entirely.
- The most clinically dangerous interferences are with potassium, LDH, and AST; even mild hemolysis can produce falsely elevated results that trigger unnecessary clinical action, including pseudohyperkalemia.
- Hemolysis is the leading cause of specimen rejection in clinical laboratories, accounting for approximately 1.99% of all submitted samples and reaching 25–30% of specimens in emergency department settings.
- Over 60% of the conditions that cause in vitro hemolysis originate before the sample reaches the laboratory; sustainable prevention requires real-time visibility into the pre-analytical phase, not protocol alone.
Frequently Asked Questions
S4DX provides real-time sample tracking across the full pre-analytical phase — from collection to laboratory receipt.
Contact us